Microsoft Excel is an extremely useful program for visually displaying data. Having said that, these spreadsheets aren’t precisely the most attention-catching things on their own. Fortunately, Excel has some options built-in that can allow you to display your figures in a more engaging, more expressive, and more meaningful way.
Sparklines and In-Cell Charts
These features help to eliminate the issues with visualization that row-after-row of numbers have, literally drawing the user a picture to put the numbers into context. The Sparkline option produces a miniature line, bar, or win/loss graph inside a cell, giving a quick, general-trend reference point.
![]()
While the in-cell charts are useful, you can also add an even more basic style and apply custom rules to your cells to reflect this. Let’s assume that the range of data pictured above represents the number of attendees at the last few events your company has thrown, with a goal of at least 16. You can make it even easier to see when this goal was reached, and when it wasn’t, with some conditional formatting.
Selecting your data, click Conditional Formatting in the ribbon above your spreadsheet. Click Manage Rules, and access the new rule you just made for your data set. There, you have a variety of options to explore. For the purposes of this example, we’re going to select arrows as the icon style, set the top two values as 16, and the bottom as 15. Once you Apply this style, you should see this:
![]()
This makes it much easier to identify months in which the goal wasn’t quite reached, and from there, make inferences into larger causes.
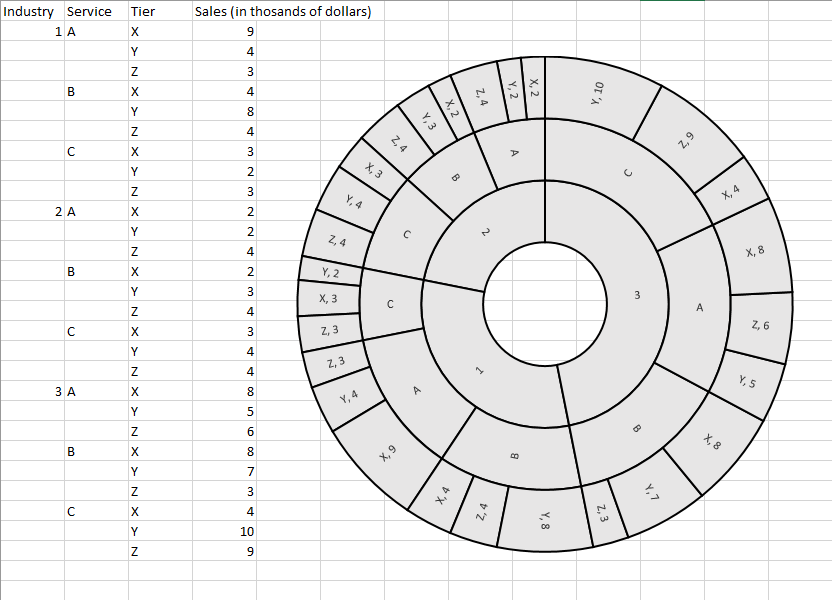
Sunburst Chart
The sunburst chart is essentially a more broken-down version of a pie chart, each slice further divided into slivers. In doing so, you can add more data into each chart for a more comprehensive picture.
Let’s say you serve three industries, 1, 2, and 3, each with three, uniquely specialized services, A, B, and C, and each service has three tiers, X, Y, and Z. Maybe you want to determine how your sales of each measure up in your total and visually see it.
Once you have all this data divided into the right columns and rows, you can insert the sunburst chart to see it, and make your business decisions accordingly.
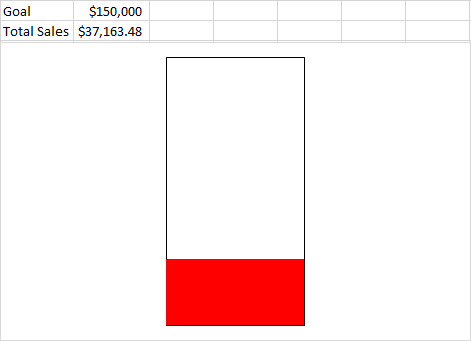
Thermometer Chart
Thermometer charts are great for motivation, whether it’s for an overall sales goal, an internal fundraiser, or any other progressing metric. This one can be a bit tricky, so make sure you follow along carefully.
Let’s assume that we’re tracking progress towards a sales goal of $150,000, and total sales thus far have equalled $37,163.48.
- In Excel, insert cells that look like this:

- Selecting them, click Insert, and under the Column Chart options, add a Clustered Column Chart item. With this item selected, click Switch Row/Column in the menu bar at the top of your screen.
- Right-click the Total Sales bar and select Format Data Series, then in the Series Options page, select Secondary Axis. You should now only see one bar, with labels on both sides.
- Right-click the label on the left and select Format Axis. The Axis Options Pane should appear. In the box for Maximum, type in your goal of $150,000. Repeat this process for the label on the right.
- Right-click the Goal Bar and select the Format Data Point option. Under Fill & Line in the menu that appears, select No fill and make the border a Solid line. Repeat this process with the Total Sales Bar, skipping the “No fill” part and choosing the colour you want instead.
- Finally, you can delete the labels on the bottom and sides (if you wish), as well as the horizontal lines, leaving you with the finished product:
How can you think to use these added Excel abilities to display data? Leave your ideas in the comments, and make sure you subscribe to Compudata’s blog!